 By Raja Vasudevan, Consultant at Stellar
A few weeks ago I completed a Predictive Analytics Nanodegree from Udacity.
I think the main takeaway from the course was related to understanding how to approach a business problem using analytics and predictive models.
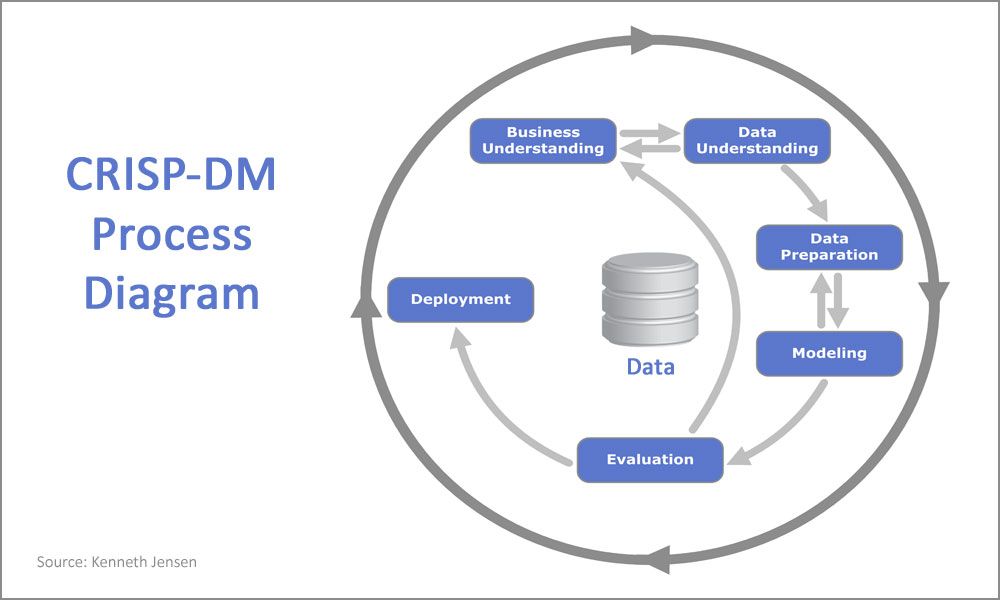
In the course, we used the Cross Industry Standard Process for Data Mining (CRISP-DM) framework. Conceived in 1996, CRISP-DM was formalised into a methodology three years later, and has since become one of the most widely used data mining process models.
CRISP-DM consists of the following “phases”:
- Business Issue Understanding
- Data Understanding
- Data Preparation
- Analysis/Modelling
- Validation/Evaluation
- Presentation/Visualisation (Deployment)
The first phase, “Business Issue Understanding”, starts with understanding the project and the business requirements. The output is a data mining problem definition which can be addressed using a decision model.
Phase 2, “Data Understanding”, is all about getting familiar with the data. It may produce some insights or suggest data subsets that are worth probing, but is also likely to turn up issues such as poor data quality, which will be addressed in the following phase.
Although each phase leads logically into the next, the CRISP-DM process is iterative. Even after a data mining solution has been deployed, the data mining continues, frequently prompting new business questions to be explored.
So what does this mean for Stellar’s customers? Using the CRISP-DM model helps us to understand their business problems and decide on the best predictive model to recommend. It also helps us prepare the models and the visualisations that make it as easy as possible for customers to understand their data and make the best business decisions.
Alteryx and Tableau
The course included preparing statistical models with Alteryx and then visualising the final data with Tableau.
Using Alteryx, analysts can deliver deeper insights more quickly than with some traditional approaches. The Alteryx workflow enables us to seamlessly blend internal, third party, and cloud data, and analyse it using spatial and predictive drag-and-drop tools. And there’s no programming required.
Tableau is a leader in Gartner’s Magic Quadrant for Business Intelligence and Analytics platforms for the fifth consecutive year. It’s ideal for use in a self-service environment. Its interactive visualisations and “Story” feature enable the Analyst/Developer to efficiently convey the context behind the visualisation.
Main image: Kenneth Jensen based on IBM SPSS Modeler CRISP-DM Guide